NEXT
Start
and then...
end of page

From the core
of the apple.
Most trading indicators begin as products. Applecore did not. Its tools were built from necessity, during years of unbiased and original market research, live observation and historical study across more than twenty years of market behaviour.
Its purpose was not to create another indicator package. It was to answer questions conventional charting could not answer clearly enough: can behaviour be anticipated; does time initiate trend behaviour; does volume reveal true intent; and why does price alone so often fail to explain what the market is doing?
The research also challenged the chart itself. Traditional candlesticks are not neutral. Directional candle colours can bias the trader before the behaviour has been properly examined, implying buying, selling, strength or weakness where the evidence may not support it. In many cases, the chart has already lied. It has told the trader what to think before they have had time to question what is actually being seen.
That research became the foundation for the tools, built originally by the author for his own analysis, and for the notes that later became the book, Applecore: Trade with extreme prejudice. Neither the tools nor the book began as commercial products. Making them available to other traders came later.
A visual system for
studying market behaviour.
Applecore tools work directly on TradingView because the system is visual by design. It is not built around abstract price numbers, P&L levels, Level 2 or Level 3 data, the market’s order book, press releases, news, signal labels or mechanical instructions. It is built to help traders and analysts see relationships forming on the chart itself, regardless of what may be behind the movement.
Those relationships can then become the foundation for strategies the trader actually understands. Rather than handing over a rigid method to copy without thought, the system provides the visual evidence, research resources and analytical principles from which traders can build, test and refine their own approach.
This is why Applecore is not a signal service and does not ask you to follow blindly. It gives you the tools, research resources and underlying principles to observe, question and investigate the market for yourself. And they do more than display information – they provoke the right questions. And once a trader starts asking better questions, the market can begin to reveal answers that conventional analysis often misses.
To understand how these tools
came to exist, we must begin with
the one that changed everything.
True Intent.
The power of the [Ti] series.
The [Ti] system began with a problem the research could not ignore. Price showed where the market had moved. Ordinary volume bars showed how much activity had occurred. What remained difficult to see was the relationship between them: what level of participation sat behind the movement, where similar activity had appeared before, and how the market behaved afterwards.
Exposing the behaviour behind the movement.
Volume Ti was built to make that relationship visible. It classified volume into distinct tiers, represented those tiers through colour, and carried the same information directly onto the price candles. Once those classifications could be seen on both volume and price, they raised further questions: How did different volume tiers relate to trend? What happened when candles with similar participation were connected? Could the same information expose continuation, weakening intent or structural relationships that price alone concealed?
Those questions led to the wider [Ti] system. Each tool approaches the market from a different direction, but they share the same underlying language of classified activity. And for years, this remained part of the author’s private research while the ideas behind it were tested, refined and challenged against live market behaviour.
Today, [Ti] defines the core of the Applecore tool structure: not a collection of unrelated indicators, but different ways of investigating the intent behind market behaviour.

Volume Ti classifies volume into distinct tiers and carries that information directly onto the price candles, allowing participation and price movement to be studied together.
In this example, the blue tier highlights what Applecore treats as the true average: the level of participation most often associated with trend confirmation and continuation. Higher-volume tiers may steer or disrupt that behaviour, but the true-average tier helps reveal whether the underlying trend is still being supported.
Today, [Ti] defines the core of the Applecore tool structure: not a collection of unrelated indicators, but different ways of investigating the intent behind market behaviour.
These tools are not the end of the research. They are the current expression of it.
Exposing the point of potential before the behaviour occurs.
By the time behaviour is obvious, much of its value may already have passed. The point of potential is the area before that moment: where time, volume or price structure suggests that something may be preparing to change or continue. Applecore tools are built to examine those areas visually. For example:
TIME: The Exchanges tool places global market times directly onto the chart, allowing the trader to study how behaviour forms around pre-market sessions, openings, lunch breaks, closings, post-market sessions and overlaps where volatility may rise or fall. There are six of these in the set.

VOLUME: Volume Range highlights the bars where activity falls within a chosen volume range. The range does not have to remain fixed. It can also be made adaptive using a multiplier range, or a mixture of static and multiplier-based values. This can support strategy development by helping the trader identify when the “right” level of volume is present for a potential position, based on their own observations, testing and market conditions.

PRICE: P²R, A+B=R and A+B=C project straight and curved rays into the future, allowing the trader to study where price may be more likely to react if it moves towards those projected areas.

These principles are explored further in the book, Applecore: Trade with extreme prejudice, where the relationship between time, volume, price and market behaviour is examined in greater depth. The tools bring those ideas onto the chart, allowing the trader to study them visually as the market moves.
The point is not any single line, band or projection. It is what those visual elements allow the trader to compare and question before the market has fully declared itself.
The examples shown here are only part of the wider Applecore toolbox. Membership includes access to more than 30 TradingView tools, all developed from the same core study of time, volume and price.
These tools are not the end of the research.
They are the current expression of it.
Research is progressive motion.
Most ideas begin with our own research. But some come from our members. We listen to their suggestions and investigate those that may reveal something genuinely useful.
We continue to challenge our own assumptions, study live behaviour and follow the new questions that emerge. This leads to the refinement of existing tools and the development of new ones.
OBSERVATION
A repeated market behaviour, unresolved question or member suggestion identifies something worth investigating.
CONCEPT
The observation is turned into a clear analytical idea, defining what the tool should examine and what would disprove it.
PROTOTYPE
A stripped-back working version is built to test the underlying logic before time is spent refining its appearance.
But not every idea earns a place in the Applecore toolbox. Some fail during testing. Others expose a better question than the one that began the investigation. Those that survive move through testing and beta use before being released.
BETA
A refined version enters controlled use, allowing practical experience and member feedback to reveal anything testing may have missed.
TESTING
The tool is challenged across different markets, timeframes and conditions to expose weak assumptions, failures and unintended behaviour.
When a new tool earns its place, it becomes available to every Applecore member. However valuable it may prove to be, it will not be withheld for another product tier or sold separately as a premium add-on.
RELEASE
Once stable, documented and ready for use, the tool joins the Applecore toolbox. Every Applecore member is informed and receives access without an additional tool charge.
UPDATE
Release does not freeze a tool in place. Errors discovered through continued use or reported by members are corrected, while worthwhile improvements from ongoing research are incorporated into the existing tool and made available to everyone.
UPDATE → OBSERVATION
Every improvement begins another cycle of observation.
We continue to challenge our own assumptions, study live behaviour and follow the new questions that emerge. This leads to the refinement of existing tools and the development of new ones.
Research does not always create something entirely new. Sometimes it returns to something familiar and asks whether it was ever understood properly in the first place.
A new colour is not a new idea.
Offering the familiar,
but with 'edge'.
Trading platforms already provide countless moving averages, oscillators and volatility bands for free. Recolouring one, adjusting a few settings and placing it behind a subscription does not transform it into original research, regardless of how impressive its new name sounds.
Applecore selects only those familiar tools whose underlying purpose remains genuinely useful. We then question what they measure, what they overlook and whether their conventional interpretation still makes sense.
The Applecore touch is not cosmetic. Inputs may change, calculations may be separated, or familiar signals may be interpreted from an entirely different perspective. The result may look vaguely familiar, but it must earn its place by revealing something new.
Just Another Stochastic is one such example. A conventional stochastic measures the closing price within a recent high-to-low range and is usually interpreted through familiar overbought and oversold levels. Applecore’s version separates the calculation into two bands derived from the highs and lows themselves.
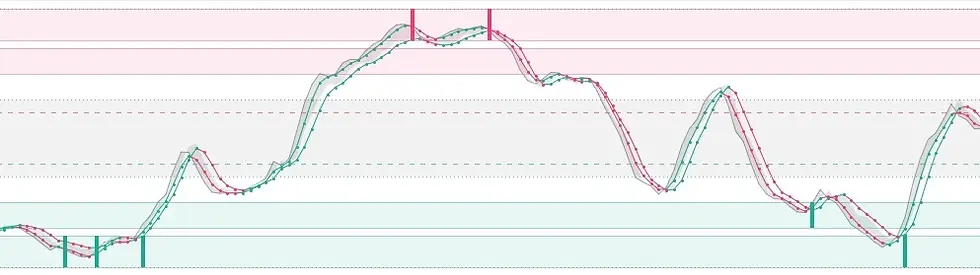
The resulting signals are not simply warnings that the market has moved “too high” or “too low”; they show how opposing high and low behaviour is interacting with established price structure.
Whether built from nothing or reconstructed from something familiar, Applecore tools are not designed to replace thought. They are designed to provoke it.
Most people stop when
the chart appears to
make sense.
Applecore is for those who keep looking.
Most people stop when
the chart appears to
make sense . . . . . . . . . . . . . . . . . . . .
Applecore is for those who keep looking.

From the core of the apple.
Most trading indicators begin as products. Applecore did not. Its tools were built from necessity, during years of unbiased and original market research, live observation and historical study across more than twenty years of market behaviour.
Its purpose was not to create another indicator package. It was to answer questions conventional charting could not answer clearly enough: can behaviour be anticipated; does time initiate trend behaviour; does volume reveal true intent; and why does price alone so often fail to explain what the market is doing?
The research also challenged the chart itself. Traditional candlesticks are not neutral. Directional candle colours can bias the trader before the behaviour has been properly examined, implying buying, selling, strength or weakness where the evidence may not support it. In many cases, the chart has already lied. It has told the trader what to think before they have had time to question what is actually being seen.
That research became the foundation for the tools, built originally by the author for his own analysis, and for the notes that later became the book, Applecore: Trade with extreme prejudice. Neither the tools nor the book began as commercial products – making them available to other traders came later.
A visual system for studying market behaviour.
Applecore tools work directly on TradingView because the system is visual by design. It is not built around abstract price numbers, P&L levels, Level 2 or Level 3 data, the market’s order book, press releases, news, signal labels or mechanical instructions. It is built to help traders and analysts see relationships forming on the chart itself, regardless of what may be behind the movement.
Those relationships can then become the foundation for strategies the trader actually understands. Rather than handing over a rigid method to copy without thought, the system provides the visual evidence, research resources and analytical principles from which traders can build, test and refine their own approach.
This is why Applecore is not a signal service and does not ask you to follow blindly. It gives you the tools, research resources and underlying principles to observe, question and investigate the market for yourself. And they do more than display information – they provoke the right questions. And once a trader starts asking better questions, the market can begin to reveal answers that conventional analysis often misses.
To understand how these tools came to exist, we must begin with the one that changed everything.
True Intent.
The power
of the [Ti] series.
The [Ti] system began with a problem the research could not ignore. Price showed where the market had moved. Ordinary volume bars showed how much activity had occurred. What remained difficult to see was the relationship between them: what level of participation sat behind the movement, where similar activity had appeared before, and how the market behaved afterwards.
Exposing the behaviour behind the movement.
Volume Ti was built to make that relationship visible. It classified volume into distinct tiers, represented those tiers through colour, and carried the same information directly onto the price candles.
Once those classifications could be seen on both volume and price, they raised further questions: How did different volume tiers relate to trend? What happened when candles with similar participation were connected? Could the same information expose continuation, weakening intent or structural relationships that price alone concealed?
Those questions led to the wider [Ti] system. Each tool approaches the market from a different direction, but they share the same underlying language of classified activity. And for years, this remained part of the author’s private research while the ideas behind it were tested, refined and challenged against live market behaviour.
Today, [Ti] defines the core of the Applecore tool structure: not a collection of unrelated indicators, but different ways of investigating the intent behind market behaviour.

Volume Ti classifies volume into distinct tiers and carries that information directly onto the price candles, allowing participation and price movement to be studied together.
In this example, the blue tier highlights what Applecore treats as the true average: the level of participation most often associated with trend confirmation and continuation. Higher-volume tiers may steer or disrupt that behaviour, but the true-average tier helps reveal whether the underlying trend is still being supported.
One tool answered the first question.
The questions that followed completed the system.
Exposing the point of potential before the behaviour occurs.
By the time behaviour is obvious, much of its value may already have passed. The point of potential is the area before that moment: where time, volume or price structure suggests that something may be preparing to change or continue. Applecore tools are built to examine those areas visually. For example:
TIME: The Exchanges tool places global market times directly onto the chart, allowing the trader to study how behaviour forms around pre-market sessions, openings, lunch breaks, closings, post-market sessions and overlaps where volatility may rise or fall. There are six of these in the set.
VOLUME: Volume Range highlights the bars where activity falls within a chosen volume range. The range does not have to remain fixed. It can also be made adaptive using a multiplier range, or a mixture of static and multiplier-based values. This can support strategy development by helping the trader identify when the “right” level of volume is present for a potential position, based on their own observations, testing and market conditions.
PRICE: P²R, A+B=R and A+B=C project straight and curved rays into the future, allowing the trader to study where price may be more likely to react if it moves towards those projected areas.
These principles are explored further in the book, Applecore: Trade with extreme prejudice, where the relationship between time, volume, price and market behaviour is examined in greater depth. The tools bring those ideas onto the chart, allowing the trader to study them visually as the market moves.
The point is not any single line, band or projection. It is what those visual elements allow the trader to compare and question before the market has fully declared itself.
The examples shown here are only part of the wider Applecore toolbox. Membership includes access to more than 30 TradingView tools, all developed from the same core study of time, volume and price.
TIME:

VOLUME:

PRICE:


These tools are not the end of the research. They are the current expression of it.
Research is progressive motion.
Most ideas begin with our own research. But some come from our members. We listen to their suggestions and investigate those that may reveal something genuinely useful.
We continue to challenge our own assumptions, study live behaviour and follow the new questions that emerge. This leads to the refinement of existing tools and the development of new ones.
But not every idea earns a place in the Applecore toolbox. Some fail during testing. Others expose a better question than the one that began the investigation. Those that survive move through testing and beta use before being released.
When a new tool earns its place, it becomes available to every Applecore member. However valuable it may prove to be, it will not be withheld for another product tier or sold separately as a premium add-on.
OBSERVATION
A repeated market behaviour, unresolved question or member suggestion identifies something worth investigating.
CONCEPT
The observation is turned into a clear analytical idea, defining what the tool should examine and what would disprove it.
PROTOTYPE
A stripped-back working version is built to test the underlying logic before time is spent refining its appearance.
BETA
A refined version enters controlled use, allowing practical experience and member feedback to reveal anything testing may have missed.
TESTING
The tool is challenged across different markets, timeframes and conditions to expose weak assumptions, failures and unintended behaviour.
RELEASE
Once stable, documented and ready for use, the tool joins the Applecore toolbox. Every Applecore member is informed and receives access without an additional tool charge.
UPDATE
Release does not freeze a tool in place. Errors discovered through continued use or reported by members are corrected, while worthwhile improvements from ongoing research are incorporated into the existing tool and made available to everyone.
UPDATE → OBSERVATION
Every improvement begins another cycle of observation.
Research does not always create something entirely new. Sometimes it returns to something familiar and asks whether it was ever understood properly in the first place.
A new colour is not a new idea.
Offering the familiar,
but with 'edge'.
Trading platforms already provide countless moving averages, oscillators and volatility bands for free. Recolouring one, adjusting a few settings and placing it behind a subscription does not transform it into original research, regardless of how impressive its new name sounds.
Applecore selects only those familiar tools whose underlying purpose remains genuinely useful. We then question what they measure, what they overlook and whether their conventional interpretation still makes sense.
The Applecore touch is not cosmetic. Inputs may change, calculations may be separated, or familiar signals may be interpreted from an entirely different perspective. The result may look vaguely familiar, but it must earn its place by revealing something new.
Just Another Stochastic is one such example. A conventional stochastic measures the closing price within a recent high-to-low range and is usually interpreted through familiar overbought and oversold levels. Applecore’s version separates the calculation into two bands derived from the highs and lows themselves.
The resulting signals are not simply warnings that the market has moved “too high” or “too low”; they show how opposing high and low behaviour is interacting with established price structure.
Whether built from nothing or reconstructed from something familiar, Applecore tools are not designed to replace thought. They are designed to provoke it.
Play. Then apply.
Applecore, built for traders and analysts who want to 'see' the market for themselves.
£49 pcm
Cancel any time.
Most people stop when
the chart appears to
make sense . . . . . . . . . . . . . . . . . . . . . .
Applecore is for those who keep looking.